Residents also spending more each month than five years ago: Survey
By Aaron Low, The Straits Times, 19 Sep 2014
By Aaron Low, The Straits Times, 19 Sep 2014

Residents here are also spending more every month compared with five years ago, with more money going into higher-quality and more expensive goods and services, such as eating in restaurants, spending on air travel and pay-TV.
These snapshots of the average resident household's income and spending patterns were captured in the latest Household Expenditure Survey, which polled more than 11,000 households.
The survey showed that average monthly incomes of resident households here rose 5.3 per cent a year between 2008 and last year, slightly slower than the 5.6 per cent annual rate in the previous five-year period.
But it was the lowest income group that had incomes rise the fastest over the period. Those at the bottom saw average monthly incomes rise by 6.6 per cent a year, growing from $1,466 to $2,022.
The Department of Statistics, which conducted the survey during October 2012 and September last year, said regular government transfers accounted for 9.3 per cent of this group's total income.
In all, government rebates, subsidies and financial aid came to nearly 90 per cent of the bottom group's average annual household income per household member before any transfers took place.
The data also gave a glimpse of the changing lifestyles of Singaporeans. The resident family now spends $4,724 on average a month, up from $3,809 five years ago. About 30.1 per cent of the monthly expenses went to housing and related expenses.
The next biggest item on the list was food, accounting for about 26.5 per cent of total expenses. Residents here spent $1,188 a month on food.
Transport came next, with households here spending about $811 on average a month. But the bulk of this expenditure was on private road transport, which cost $574 a month on average. Households here spent just $167 a month on public transport.
Together, all three items accounted for nearly two-thirds of monthly expenses on average, noted the Statistics Department.
But while things did get more expensive, with inflation at 3.1 per cent a year on average over the past five years, the Statistics Department also noted that increases in household expenditure "partly reflect lifestyle changes and spending on better-quality products and services".
In all, growth in household income continued to outpace growth in expenditure, a trend which bodes well for households, said OCBC economist Selena Ling. She noted that the past five years had been a difficult period, starting with the recession as well as rising inflation.
"Given all that, it's encouraging that we see incomes outpacing expenditure growth. We are seeing the effects of fiscal help for some of the poorest households," she said.
Incomes rise faster for HDB households
5.2% growth a year outpaces figures for condos and landed property
By Janice Heng, The Straits Times, 19 Sep 2014
5.2% growth a year outpaces figures for condos and landed property
By Janice Heng, The Straits Times, 19 Sep 2014

Households in Housing Board flats had higher income growth than those in condominiums and landed property. And although income from work went up, it now forms a smaller proportion of overall household income.
HDB household incomes grew 5.2 per cent a year on average, according to the Department of Statistics' Household Expenditure Survey, conducted every five years.
The latest survey is based on data from 2012 to last year.
In contrast, incomes rose 3.6 per cent a year for households in condos and other apartments, and 4.2 per cent for those in landed properties.
In absolute terms, the gap is still stark. The average monthly income was $7,900 for HDB households, while it was $20,536 for households in condos and $26,058 for those in landed properties.
But with incomes growing faster at the bottom, the income gap seems to have narrowed, noted SIM University economist Randolph Tan. The bottom fifth saw annual income growth of 6.6 per cent, compared with 4.7 per cent for the top fifth.
Overall, household income growth was driven by rises in work and non-work incomes.
Business income rose an average of 5.2 per cent a year, while employment income rose 3.9 per cent. Non-work income grew the fastest, at 22 per cent a year.
The differing growth rates meant that although employment income still forms the bulk of income, its share has fallen.
It accounts for 78.6 per cent of household income, down from 84 per cent five years ago.
Business income continued to account for 11 per cent of income.
But the share of non-work income doubled to 10.5 per cent, from 5 per cent five years ago.
It was especially significant for households in the bottom fifth.
Such households get an average of $536 in such income each month. This represents more than a quarter of their income, up from less than a fifth five years ago.
More than half of this is from sources such as relatives and friends, as well as Central Provident Fund payouts. Retiree households form a quarter of households in the bottom fifth.
But much non-work income also comes from the Government, for instance, in the form of GST Vouchers and Workfare Income Supplement scheme payouts.
For households in the bottom fifth, almost $1 out of every $10 in income comes from regular government transfers, noted Nanyang Technological University Assistant Professor Walter Theseira.
"So, a large part of their income increase is because of the increase in generosity of transfers."
But this is not a good strategy in the long run, he added. "The Government will need to look at policies that help them increase their job earnings."
Those at the top are also getting more income from non-work sources, with an average of $2,956 a month. But this is mainly rental and investment income.
Govt help boosts income, cuts costs for the poor
By Janice Heng and Walter Sim, The Straits Times, 19 Sep 2014
By Janice Heng and Walter Sim, The Straits Times, 19 Sep 2014
HELP extended by the Government has boosted the income of low-income households and reduced the amount they have to spend, according to the Household Expenditure Survey released yesterday.
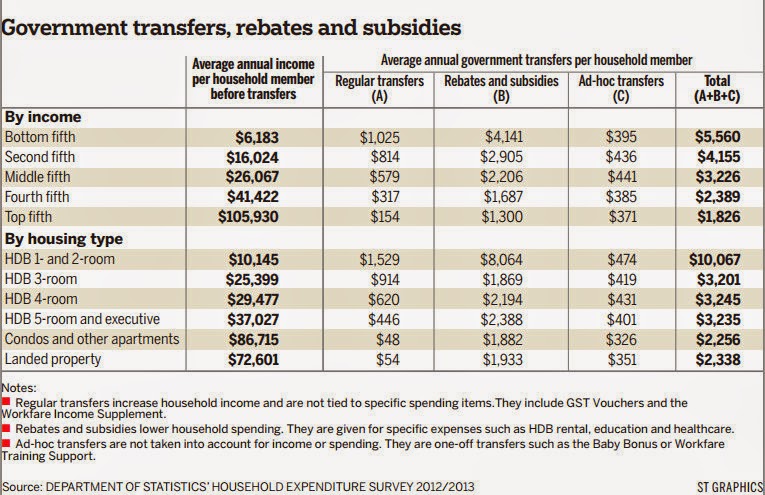
Households living in one- and two-room Housing Board flats receive an annual average of $10,067 per household member in government transfers, rebates and subsidies. This is close to their annual income per member before transfers, which is $10,145.
Similarly, households in the bottom fifth receive an annual average of $5,560 per household member in transfers, on top of their $6,183 pre-transfer income per household member.
This is the first time that the survey, done every five years, has looked at the effect of government transfers on household income and spending. The significant impact they have on poor households comes against the backdrop of increased efforts to address the widening income gap.
For instance, the Workfare Income Supplement scheme, introduced in 2007 to top up the pay of low-wage workers, was enhanced in 2010 and 2013 to cover more workers and give higher payouts.
But the bulk of government transfers is in the form of rebates and subsidies. These include subsidies for education and housing, as well as HDB rental rebates. One- and two-room HDB households receive $8,064 in rebates and subsidies annually per member.

His 44-year-old wife, who works as a part-time cleaner, also receives Workfare payouts.
Economist Randolph Tan, however, warned against relying too much on transfers. "The main concern is that one cannot hand out money from an empty kitty."
The Government should continue to give transfers, "but in a considered manner", he said.
All income groups forking out more for finer things
By Charissa Yong, The Straits Times, 19 Sep 2014
By Charissa Yong, The Straits Times, 19 Sep 2014

Overall, household monthly expenditure rose by 4.4 per cent a year on average - from $3,809 to $4,724 - between 2008 and 2013.
This was higher than the annual increase of 2.6 per cent recorded over the previous five years.
The Department of Statistics gave this bird's eye view of spending levels and patterns in its latest Household Expenditure Survey, out yesterday.
The survey showed that housing, food and transport continue to make up the biggest share of household expenditure.
Households spent an average of $811 a month on transport, up from $700 previously.
The increase is due mainly to higher expenditure on flights and private transport. Public transport expenditure rose from $157 to $167 a month over the same period. Private transport expenses - mainly cars - rose to $574 a month, from $531 five years ago, mostly due to more spending on car maintenance and petrol.
People are dining out more often and at more upscale eateries. Households spent an average of $764 a month dining out, up from $592 five years ago and $466 a decade ago.
The proportion of spending on restaurants, cafes and pubs also rose to 35 per cent of food services, up from 22 per cent 10 years ago.

Middle-income households experienced the biggest increase in spending. The average monthly expenditure of this group rose by 5.5 per cent a year.
Sales manager David Koh, 49, felt that his family of four spends more today compared to five years ago. He and his civil servant wife, 40, together take home about $9,000 a month.
"When we stock up on groceries for the week at the supermarket, we can spend $200 now, when we used to spend $100."
Efforts to narrow income gap bearing fruit but challenges remain
By Aaron Low, The Straits Times, 19 Sep 2014
By Aaron Low, The Straits Times, 19 Sep 2014
IF THERE is one key takeaway from the latest Household Expenditure Survey, it is that the drive to help the lowest income group is bearing fruit.
The Government began to pay much more attention to the lower-income group almost 10 years ago, when the income gap started to grow wider, fuelled by globalisation, free movement of cheap labour and technological progress.
These forces rewarded high-skilled talent, but pushed down wages for low-wage workers even as they ravaged jobs in the middle for many countries, including Singapore.
The Government began its efforts to close the gap in earnest when it turned the Workfare Income Supplement into a permanent scheme in 2007.
Then, over the following years, it sharpened its redistributive policies, giving more to those at the bottom, and in a more targeted fashion. Examples of such efforts include the regular goods and services tax (GST) rebates, U-Save vouchers, and education and health subsidies.
Yesterday's national survey findings showed that such policies have had a positive impact on the group near the bottom.
Average monthly incomes for this group rose by 6.6 per cent a year over the past five years, much faster than the 5.3 per cent average rate for all groups.
Significantly, too, for the bottom 20 per cent, income grew just 4.5 per cent a year in the previous five-year period.
To be sure, the pace of growth means little especially if the incomes differ so much between the top and bottom earners.
Average monthly income for the top was $24,544, more than 12.13 times the $2,022 for the bottom 20 per cent.
But the gap between the top and bottom was even bigger - more than 13 times - the last time this survey was conducted.
So, it is fair to say that progress has been made.
Qualitatively, the expenditure figures also give hope that lives for those at the bottom are improving.
The survey showed that those at the bottom were spending on items such as mobile phones and pay-TV.
Five years ago, just under one in four of the bottom 20 per cent of households had pay-TV. Today, some 39.2 per cent of households are watching cable television.
Mobile phones, seen as essential in today's Internet era, also saw higher penetration among low-income households. Nearly nine in 10 now own at least one mobile phone, up from seven in 10.
The digital divide remains, but is narrowing.
The proportion of households in the bottom 20 per cent which have Internet subscription and access nearly doubled from 29.8 per cent to 49.5 per cent. But among the highest earning households, 95.2 per cent have such access.
Does this mean the battle against inequality will get easier?
No. The opposite is probably true: It will get harder from now on.
OCBC economist Selena Ling said: "With the large chunks of the puzzle already in place, such as Workfare, we will probably see a stabilisation of income growth at the bottom from now on."
The next step must be to see how the Government can continue to narrow the gap without draining the state's coffers.
To do that, it will have to continue to judiciously target its financial aid and subsidies. It will also have to start thinking about raising taxes - Robin Hood-style - to fund subsidies for those at the bottom.
The Government has said that it will not raise taxes this current term. However, we are just slightly beyond the mid-term, so some serious thinking on this front may be in order.
How the Government balances these different pressures, with an election looming in 2016, will be keenly watched - and felt.
'Income gap closing but poorest may not feel effect'
Higher cost of living may have muted rise in household income: Observers
By Charissa Yong, The Straits Times, 20 Sep 2014
Higher cost of living may have muted rise in household income: Observers
By Charissa Yong, The Straits Times, 20 Sep 2014
EXPERTS welcomed the news that the income growth gap between rich and poor has narrowed in the past five years but also questioned the extent to which the lowest-income earners are better off.
The four economists and four Members of Parliament were responding to the latest Household Expenditure Survey, released on Thursday.
It found that average monthly household income went up from 2008 to last year, with the bottom fifth experiencing the fastest pace of growth.
But the observers said the higher cost of living may have dampened the effect of higher incomes.
The bottom fifth of households saw average monthly incomes rise by 6.6 per cent a year over the five-year period, while inflation was 3.1 per cent a year on average.
DBS economist Irvin Seah said: "Their increase in average household income in terms of purchasing power is significantly less than what the 6.6 per cent growth figure suggests."
UniSIM economist Randolph Tan said: "The bad news is that the low income are still the most badly hit by price rises."
The survey also found that the bottom fifth of households still spend more than their regular take-home pay. Households in this group earned $2,022 a month on average, but spent $2,231.
But the gap between expenditure and incomes has narrowed from five years ago, the Department of Statistics said, adding that households may have other sources of income not reflected in the survey, such as from property sales or lump-sum Central Provident Fund withdrawals.
Mr Seah said the gap between income and expenditure could be because more in the lower income group are retired, and spending more on needs like health care.
Ang Mo Kio GRC MP Inderjit Singh said that if the higher expenditure was due to higher prices of basic items, instead of spending on pricier items, then he was worried that "inflation will negate rising income levels unless wages can rise even faster".
But improvements to the incomes of the poor have been significant, driven almost entirely by government transfers, said the economists and MPs.
For one- and two-room households, the average annual income per member was matched nearly dollar for dollar by government transfers like GST Vouchers and the Workfare Income Supplement.
Barclays economist Leong Wai Ho said: "We might be finally starting to reverse the widening of the income gap."
But it may not be sustainable to rely indefinitely on transfers to further improve the lot of the lower income as that requires strong economic growth to generate revenue, said the experts.
Chua Chu Kang GRC MP Zaqy Mohamad said: "The last thing you want is for everyone to have expectations that the Government will always step in and fill the gap when workers have low pay."
Instead, the focus should be on growing real wages, said Bank of America Merrill Lynch economist Chua Hak Bin, Nanyang Technological University economist Walter Theseira and Pasir Ris-Punggol GRC MP Zainal Sapari.
"It's best to look at subsidies and transfers as measures to keep households afloat while we look at how to help them be able to earn more," said Dr Theseira.
Such measures should include training and upgrading the skills of low-wage workers to raise their pay and give them more opportunities, said Dr Chua and Holland-Bukit Timah GRC MP Liang Eng Hwa.
New survey gives snapshot of typical retiree households
By Janice Tai And Linette Lai, The Straits Times, 20 Sep 2014
By Janice Tai And Linette Lai, The Straits Times, 20 Sep 2014

A retiree household living in a three-room flat spends an average of $1,000 every month, of which a third goes to food and another third to housing, utilities and health expenses.
These snapshots of the average retiree's income and spending patterns have been captured for the first time in the latest Household Expenditure Survey, which polled more than 11,000 households.
The number of retiree households, defined as those comprising solely non-working people aged 60 years and over, has more than doubled in the last 13 years to 77,481. About 40,000 of them live in three- or four-room flats.
The retiree households have also been found to form a quarter of households in the bottom fifth of the population where income is concerned.
"The data is interesting as it is rare but it is insufficient for planning purposes," said Ms Peh Kim Choo, director of the Hua Mei Centre for Successful Ageing under the Tsao Foundation, which works closely with the elderly.
"Nowadays, post-retirement periods can stretch to 30 years so it will be good to know the costs needed for different retirement phases and whether those needs are being met."
The Department of Statistics, which conducted the survey during October 2012 and September last year, said the majority of these elderly households fell under the lower-income groups because they do not get income from work. Some may rely on children living elsewhere or social support to meet their needs while others finance their retirement using savings and investment returns.
Retiree households are also spending more every month. They shelled out an average of $1,700 last year, compared to $1,300 five years ago.
However, the bottom fifth of these households spent only $480 a month, compared to $4,120 for the top 20 per cent.
The divide that has emerged in the retiree class is also apparent when income levels are considered.
On average, those who retire in condominiums and other non- Housing Board apartments have a monthly income of $3,851 - six times that of those who live in one- and two-room flats, and more than double that of those staying in five-room and executive flats.
But this gap is not as wide as that between the poorest and the well-heeled segments in the general population. The survey found that households in condominiums and other non-HDB apartments earn an average of $20,536, about 10 times the income of those in one- and two-room flats.
Experts say that the gap between these groups narrows in retirement because people stop working.
"It's largely because of the loss of income from work, which hits richer people far more as a proportion of their income than poorer people," said Assistant Professor Walter Edgar Theseira of Nanyang Technological University.
"In retirement, the rich generally have investment income streams to fall back on, whereas poorer retiree households are very dependent on government transfers, subsidies and family contributions."
National University of Singapore sociologist Paulin Straughan also noted that the lowest-income households actually spend more than they earn each month, while even those who live in condominiums and other apartments are earning just $428 more on average than they spend.
This is worrying, she said, because health-care expenditure tends to go up as the population ages. "(The latter) are just about able to cover their expenses. All it takes (to put them in the red) is for expenses to go up when they fall ill."
She's 'retiring comfortably'
By Linette Lai, The Straits Times, 20 Sep 2014
 Retired teacher Lucy Tay, 65, lives with her 70-year-old husband in a flat in Jurong.
By Linette Lai, The Straits Times, 20 Sep 2014
Together, they spend about $1,200 a month, mostly on food and utilities.
On her own, Madam Tay uses up about $2,000 a month on things like shopping or eating out, adding up to a combined expenditure of around $3,500 for the two of them.
Some of the money comes from her savings, she said, although the investments made when she was younger are also beginning to bear fruit.
Some of the money comes from her savings, she said, although the investments made when she was younger are also beginning to bear fruit.
"I bought endowment plans and shares," she said. "The income is not fixed, so it's hard to say how much I get every month."
She also gets around $900 in monthly payouts from the Central Provident Fund. Her husband, a permanent resident, does not get these.
"One thing I can safely say is that I'm retiring comfortably," Madam Tay said.
"I consider myself lucky," she said. "If I want to go for a meal, I just go."
12 interesting trends about Singapore household income and spending
By Janice Heng, The Straits Times, 18 Sep 2014
By Janice Heng, The Straits Times, 18 Sep 2014
How has the Singapore household changed over the last five years? Here are 12 interesting findings from the Household Expenditure Survey 2012-2013. The survey is conducted by the Department of Statistics every five years.
1. We are earning more as a family
The average monthly household income was $10,503, up from $8,105 five years before.
1. We are earning more as a family
The average monthly household income was $10,503, up from $8,105 five years before.
2. Our income is growing faster than prices in general
Household incomes rose an average of 5.3 per cent a year in dollar terms, keeping ahead of inflation, which averaged 3.1 per cent a year.
3. We are earning more than we are spending
Our income is growing faster than our spending. Average household spending rose only 4.4 per cent, to $4,724 a month.
4. Which group's income is growing the fastest?
Households at the bottom saw their incomes rising the most. The average income of the bottom fifth rose 6.6 per cent a year, to hit $2,022. Those in the top fifth had income growth of just 4.7 per cent a year.
5. Where is our income coming from?
We are getting more money from our jobs, but also from other sources.
For households at the bottom, non-work income was mainly from government transfers such as the Workfare Income Supplement and other sources such as contributions from relatives.
For those at the top, their non-work gains came from rental and investments.
6. We are spending more
For all income groups, expenditure rose more in the last five years than in the five years before.
7. ...And it's not just because of higher prices
It's also because we're spending more on higher quality goods and services, such as dining out in restaurants. 34.9 per cent of our food expenditure is spent in restaurants, cafes and pubs, up from 26.8 per cent in the five years before.
8. ...But we still love our kopi-o and chicken rice
8. ...But we still love our kopi-o and chicken rice
Of all the money we spend on food, most is still spent in hawker centres, food courts and coffee shops - 57.7 per cent.
9. What are we spending most on?
The average household spends $1,188 a month on food, $811 on transport, $154 on package tours and holidays, $138 on other recreational and cultural pursuits, and $156 on clothes and footwear.
10. Almost everyone has a mobile phone
Ninety-seven per cent of households own a mobile phone, compared to 94.5 per cent five years ago and 88.8 per cent 10 years ago. This rise is across the board - higher proportion of lower income households, as well as those in one- and two-room HDB flats, are now owners of mobile phones.
11. Who still uses residential phone lines?
Residential telephone lines are going out of fashion. In 2012 to 2013, 82.2 per cent of households had residential telephone lines, down from 88.3 per cent five years ago and 93.1 per cent 10 years ago.
12. Laptops and tablets are in, desktops are out
More people own computers but they prefer laptops and tablets to desktops. Forty per cent of households have only laptops or tablets compared to 16 per cent five years ago. Ownership of desktops meanwhile has dropped from 61 per cent to 43 per cent.
 ONE of the regular messages from this column on managing one's personal finances is to track one's expenses religiously.
How much are S'poreans saving?
A lot, it seems, with savings rates of 33% to 69% as per latest data. But about 25 percentage points is probably due to CPF
By Cai Haoxiang, The Business Times, 22 Sep 2014
A lot, it seems, with savings rates of 33% to 69% as per latest data. But about 25 percentage points is probably due to CPF
By Cai Haoxiang, The Business Times, 22 Sep 2014

That is, to painstakingly catalogue how much of your money goes into food, transport, clothing, healthcare and so on. But have you ever wondered how the entire nation spends?
A treasure trove of data was published last Thursday when the Department of Statistics released the results of its latest Household Expenditure Survey, held once every five years.
What are its implications for the investor?
The data can prove useful in benchmarking yourself against the population to see where you stand in saving and spending.
The survey ranked households according to how much they earn and dissected their expenditures accordingly.
From the charts, one can see that the lowest fifth of households spends more than what they earn. That puts them in a deficit every month. The other four fifths of households are in surplus every month.
Interestingly, this group is increasingly spending a smaller chunk of their income over time. By implication, they are saving more over time. Similarly, the deficit of the lowest fifth of households as a proportion of their income is narrowing over time.
We can calculate a "savings rate" based on how much is left over after spending, as a proportion of one's original income.
For example, in 2002-3, the fifth of households that is second from the bottom, the 21st to 40th percentiles, saved 20 per cent of their income. In 2012-3, they were saving about a third.
The top fifth of households saved 63 per cent of their income in 2002-3. In 2012-3, they were saving a whopping 69 per cent.
Even the 41st-60th percentile, a group that is solidly middle class, appear to be saving 44 per cent of their income every month.
The numbers are puzzling, given the vociferous complaints about how Singapore has become a much more expensive place to live in.
Are expenditures understated?
The survey looks extremely rigorous. It covered over 8,000 households in Singapore, and spanned over a year to ensure spending patterns during festivals and holidays were captured. Mortgage payments and renovation expenses were also included. Ad-hoc spending on big-ticket items like holidays, weddings and funerals were also included to minimise under-reporting of expenditure. The latest survey even included a section on spending on Internet purchases.
However, non-consumption expenditure such as loan principal repayments, income taxes, and the purchase of houses - a major distortional figure - were not included.
Income taxes are not significant for most of the population except for the highest earners. So the top fifth of the population probably save less than they appear to.
Are income numbers giving a wrong impression then? These include employer Central Provident Fund (CPF) contributions to give a fairer reflection of what constitutes income.
Money in the CPF, however, is not perceived to hold the same value as money in the bank because there are restrictions on how one can spend that money. Let's say that we just want to figure out how much money is going into the bank every month, excluding money going into CPF accounts. Once we exclude employer CPF contributions from our definition of "savings", savings rates fall to 24 per cent to 43 per cent for the middle three-fifths of the population.
We then take out employee CPF contributions, which can be up to 20 per cent of one's income. If we assume that the maximum 20 per cent is put into CPF, we are left with more modest savings rates of 9 to 28 per cent for the middle three-fifths.
In other words, if your household belongs to the middle three-fifths of the population by income and the household saves anywhere from 10 to 30 per cent of its total income in cash, it is saving at a rate comparable to its peers.
In essence, enforced CPF contributions probably contribute another 25 percentage points to one's savings rate.
After crunching the numbers, the typical household probably saves S$1,500 in cash every month, while the above-average household by income can put about S$3,000 in the bank. Money for the top fifth of households, meanwhile, is probably piling up at the rate of about S$10,000 a month.
For the rest of the population, the CPF system is helping them save a considerable amount of money - equal to or more than what they can leave in a bank.
Most people will probably not see their bank balances grow at the same rate as CPF's, leading to worries about not making ends meet and angst about how much money is locked away in the provident fund.
But seen from the outside - with Americans typically having personal savings rates of just 5 per cent - Singaporeans aren't doing too badly on the savings front.
No comments:
Post a Comment